INTRODUCTION
THE TEMPERATURE and its distribution of a pulverized coal flame in an industrial furnace provide useful information for the in-depth understanding of combustion processes including coal devolatilization, radiative heat transfer, pollutant formation process, and the cause of combustion problems such as slagging and fouling. However, accurate and reliable temperature profiling of a pulverized coal flame remains a challenge
Optical radiation pyrometry has been recognized as the only practical nonintrusive method of measuring the temperature of flying particles in a flame . However, commontotal radiation or single-wavelength pyrometers cannot provide the accurate temperature measurement of the flame because the emissivities of particles in the flame are normally unknown. A two-color pyrometric system measures the temperature by determining the radiative intensities of the object to be measured for two given wavelengths regardless of the absolute emissivity and has therefore been widely applied to the temperature measurement of flames in various situations.
The availability of low-cost charge-coupled device (CCD) sensors and recent advances in digital image processing techniques have overcome the drawback of a conventional two color pyrometer where only the average temperature within a small area of the flame field is detected. A number of CCD based two-color systems have been developed in recent years for the measurement of temperature distribution of pulverized coal flames
This paper presents an instrumentation system for the measurement of temperature and its distribution in a coal-fired flame field based on the three-color technique. A unique beam-splitting/beam- filtering device is designed that splits and filters the light of flame into three narrow-band beams. A high-
resolution CCD camera collects the three beams of the flame light and forms three images that are identical in size but are of different wavelengths.The three resulting images give three combinations of either two images. Three two-color temperature distributions of the flame are then computed simultaneously using the three image pairs. The final temperature of each point in the flame is estimated from the weighted average of the three two-color temperature values for improved accuracy and reliability. Key design aspects of the system together with the experimental results obtained on an industrial-scale combustion test facility are addressed and discussed. It should be stressed that although a number of multicolor pyrometric devices have been developed and used in various applications, there are no multicolor instrumentation systems available for online, continuous, and two-dimensional (2-D) temperature profiling of a pulverized coal flame.
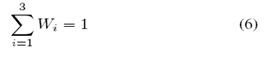
MEASUREMENT PRINCIPLE
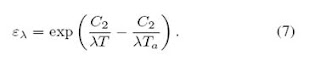
A brief summary of the operating principles of three colour pyrometry is given here. In this paper, the emissivity of the flame is considered to be unevenly distributed in consideration of the fuel blends being fired. By applying Planck’s radiation law, the monochromatic emissivity of a non black body at a given wavelength λ can be expressed as
where Ta(K) is the apparent temperature of the nonblack body, which is defined as the temperature of a black body that emits the same radiation intensity as the nonblack body at temperature T, and C2 is the second Planck’s constant (1.4388 * 10^-2 mK). For sooting particles in a flame, ελ can also be estimated by the widely used empirical equation expressed as follows:
where k(m-1) is the absorption coefficient, l(m) is the geometrical flame thickness along the optical axis of the imaging system and α is an empirical parameter depending upon λ. For the visible spectral range, α is considered to be a fixed value of 1.39 for a steady luminous flame . Substituting equation(2) into equation(1) yields
The unknown product kl can be eliminated by rearranging equation(3) for two different wavelengths λ1 and λ2, i.e., axis. Due to the fact that the temperature may not be constant
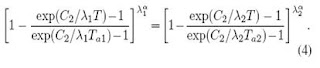
The unknown temperature T can be determined by solving equation(4), provided that the apparent temperatures Ta1 and Ta2 are known for λ1 and λ2, respectively. In practice, the values of Ta1 and Ta2 are obtained by calibrating the system using a standard temperature source.
Because the third optical path
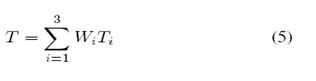
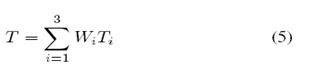
at wavelength λ3 is available in the three-color system, three two-color temperatures can be calculated using equation (4) for the three image pairs, i.e., λ1/ λ2, λ1/ λ3, and λ2/ λ3. The true temperature of the flame can then be determined by the weighted average of the three two-color temperatures i.e.,
 where
where

where Ti is the two-color temperature for the ith wavelength pair, and Wi is the weighting factor for Ti. A larger weighting factor is assigned to the temperature of smaller variance, whereas a smaller weighting factor is assigned to the temperature of larger variance.
During pulverized coal combustion, both solid particles and gaseous combustion products are present. There exists a temperature difference between a particle and its surrounding gas. This difference depends upon the rate at which heat is transferred by radiation from the particle to the gas and by convection between the gas and the particle. In view of the fact that the diameters of the distinct soot particles range from 0.025 to 0.06 μm , the temperature difference between the soot particles and their surrounding gas is expected to be less than 100C . On the other hand, although coal particles can be as large as over a hundred micrometers, they are surrounded by a soot cloud that is generated from the volatile matter decomposed from the particles at high temperature, particularly at the early stage of the combustion. Therefore, the temperature obtained using the proposed method is more likely the soot temperature rather than that of the coal particles. It should also be noticed that, in this paper, the temperature measurement is made along horizontal optical paths perpendicular to the burner axis. Due to the fact that the temperature may not be constant along the optical path, the measured temperatures represent line-of-sight averages weighted by the particle concentration across the thickness of the flame. It has been proven that the line-of-sight temperatures were reasonably representative of those in the particle-laden regions of the flame, particularly the root region. Furthermore, along the optical path, hotter particles weighed more than cooler particles, and therefore the calculated temperature would be close to that of hotter particles along the optical path.
IMPLEMENTATION OF THE SYSTEM
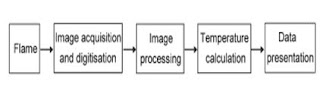
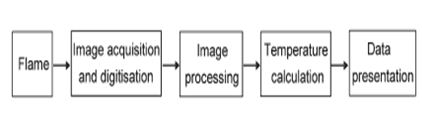
The system consists of a CCD camera, a beam- splitting/beam-filtering device, a frame grabber, and a microcomputer with application software. Fig. 1 shows the block diagram of the system design.
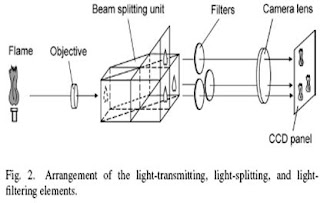
Fig. 2 illustrates the arrangement of the light-transmitting, light-splitting, and light-filtering elements. The beam-splitting/beam-filtering device receives
the light of the flame through an optical probe and split the light into three identical beams for three different wavelengths. high-resolution monochromatic camera collects the three beams of the light of flame and forms three images that are identical in size but responsible for different wavelengths. The frame grabber, which incorporates with the microcomputer, transfers the image signal into 2-D digital images with an eight-bit digitization. Application software, as an integral part of the system, processes the digital images and then derives the flame temperature on an online and continuous basis.
CHOICE OF WAVE LENGTHS
The choice of the wavelengths is one of the crucial factors in the design of the multicolor system, and there are a number of considerations that must be taken into account.
1) Visible and infrared wavelengths can be used in a two-color system. Visible wave lengths are preferred because;
• Rate of change of the spectral radiance with respect to temperature is greater in the visible spectral range than in the infrared spectral range, resulting in higher sensitivity and higher signal to noise ratio of the system.
• in equation(4) is fairly independent of the wavelength and most types of fuel in the visible spectral range and therefore, the calculation can be simplified.
2) The wavelengths must be far from the absorption bands of gas molecules and free radicals in the reaction zone of the flame such as OH, CH, C2, HCO, and NH, which may be formed and give appreciable emission in the visible and near-ultraviolet regions.
3) The bandwidths of the filters should be as narrow as possible to acquire a single-wavelength radiation and, meanwhile, allow enough light passing through.
4) The pair of the selected wavelengths should be separated to achieve a higher signal-to-noise ratio of two image signals.
However, a farther-apart wavelength pair can cause overexposure of the imaging sensor at one wavelength and underexposure at other. Compromising the factors addressed as given rise to the selection of the three wavelengths at 550,632,700nm with a bandwidth of 40nm.
CALIBRATION AND ACCURACY
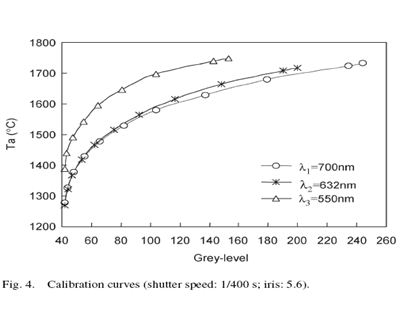
The system was calibrated to determine the apparent temperatures Ta1, Ta2, and Ta3 at the chosen wavelengths λ1, λ2, and λ3 to establish the relationships between the apparent temperatures and the corresponding gray levels of the images.
A gas-filled tungsten lamp was used as a standard light source for the calibration. Calibration using a tungsten lamp has been proven to be practical, reliable, and reasonably accurate. The lamp was precalibrated at a wavelength of 662.4 nm with regard to the apparent temperature ranging between 700 and 15000C . It is understood that these precalibrated data have to be corrected against the selected three wavelengths, i.e., determining the apparent temperatures of the tungsten lamp for 550, 632, and 700 nm wavelengths, respectively, prior to calibration of the imaging system. This can be done by, first, determining the true temperature of the tungsten lamp. Equation (1) can be written by applying Wien’s radiation law, i.e.,
Rearranging (7) gives
This means that the true temperature of the tungsten lamp can be obtained if the emissivity ελ is known. The emissivity of tungsten is a function of the wavelength and the true temperature, the emissivity can be calculated using Larrabee’s equations as follows:
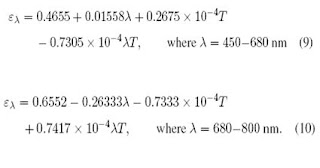
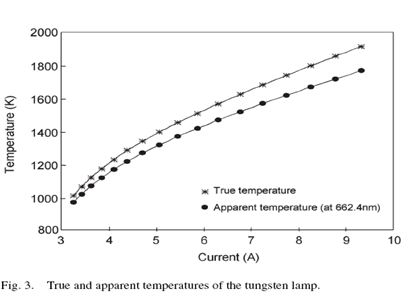
As can be seen, there are two variables, i.e., T and λ, in equation (9) and equation (10). An iterative process has to be taken to obtain the true temperature and the emissivity, i.e., emissivity ελ is first computed using the apparent temperature Ta at the 662.4-nm wavelength provided by the calibration certificate of the tungsten lamp based on (9). An intermediate value of the true temperature is then computed using ελ obtained from the first step based on equation (8). With the intermediate value of the true temperature, a new value for ελ is calculated using equation (9). The preceding procedures are repeated until the difference between the two consecutive values of the true temperature is insignificant. The true temperature of the tungsten lamp can be determined for each setting of the apparent temperature, which is controlled by the current provided by a high-stability and high-capacity dc power supply.

Fig. 3 shows the curves of the apparent temperature and the computed true temperature of then tungsten lamp versus the current.
Once the true temperature of tungsten has been determined, the apparent temperatures can be computed against the selected three spectral wavelengths using equation (8) and equation (9) (for 550 and 632 nm) or equation (8) and equation (10) (for 700 nm). The procedure of the calibration was, first, to reproduce the geometrical relationship between the imaging system and the flame to be measured. Three banded images of the filament were captured, and the gray levels of the images were averaged. The relationships between the apparent temperatures of the tungsten filament and the gray levels of the images was then identified for the given spectral wavelengths. The calibration was therefore conducted for different camera settings and calibration curves is as shown in fig.4.

It can be seen that the relationships between the apparent temperatures of the tungsten filament and the gray levels of the images appear to be nonlinear. It is impossible to produce regression equations without losing the accuracy of the measurement. Therefore, the calibration data are stored in the form of lookup tables, through which a unique relationship between every possible gray level in banded images and the corresponding apparent temperature is defined for a given wavelength.
CONCLUSION
An instrumentation system for the monitoring of temperature and its distribution in a coal-fired flame has been developed based on the three-color pyrometric and digital imaging techniques. A high-resolution CCD camera, together with a sophisticated beam-splitting/beam-filtering device, enables receiving the light of flame and produces three images for three distinct wavelengths. The three resulting images provide the basis of the determination of three two-color temperatures. The true temperature of the flame is estimated by the three weighted two-color temperatures, hence, the accuracy and reliability of the measurement have been improved.